Earth Watershed “Children” Maps
This pair of maps is the inverse of each other. That may not be correct English–this pair of maps is the inverse of itself?–but the red system of lines in each map’s central continent(s) divides that land into its constituent watersheds, and is used to make the edge of the other map. Each map is a “child” or offspring of CSNB map #2 because they use only a portion of the boundary of that map. If the boundary of csnb map #2 is a tree when viewed on the globe (or when flattened as a stick figure) these maps may be thought of as prunings of that more interrupted, more intricately branched map. It takes only a moment to realize that there are a great many different configurations beyond just these two. Indeed there is a map continuum that flows from csnb map #2 into this pair and beyond, all they way down to a single point, but we won’t go there in this post.
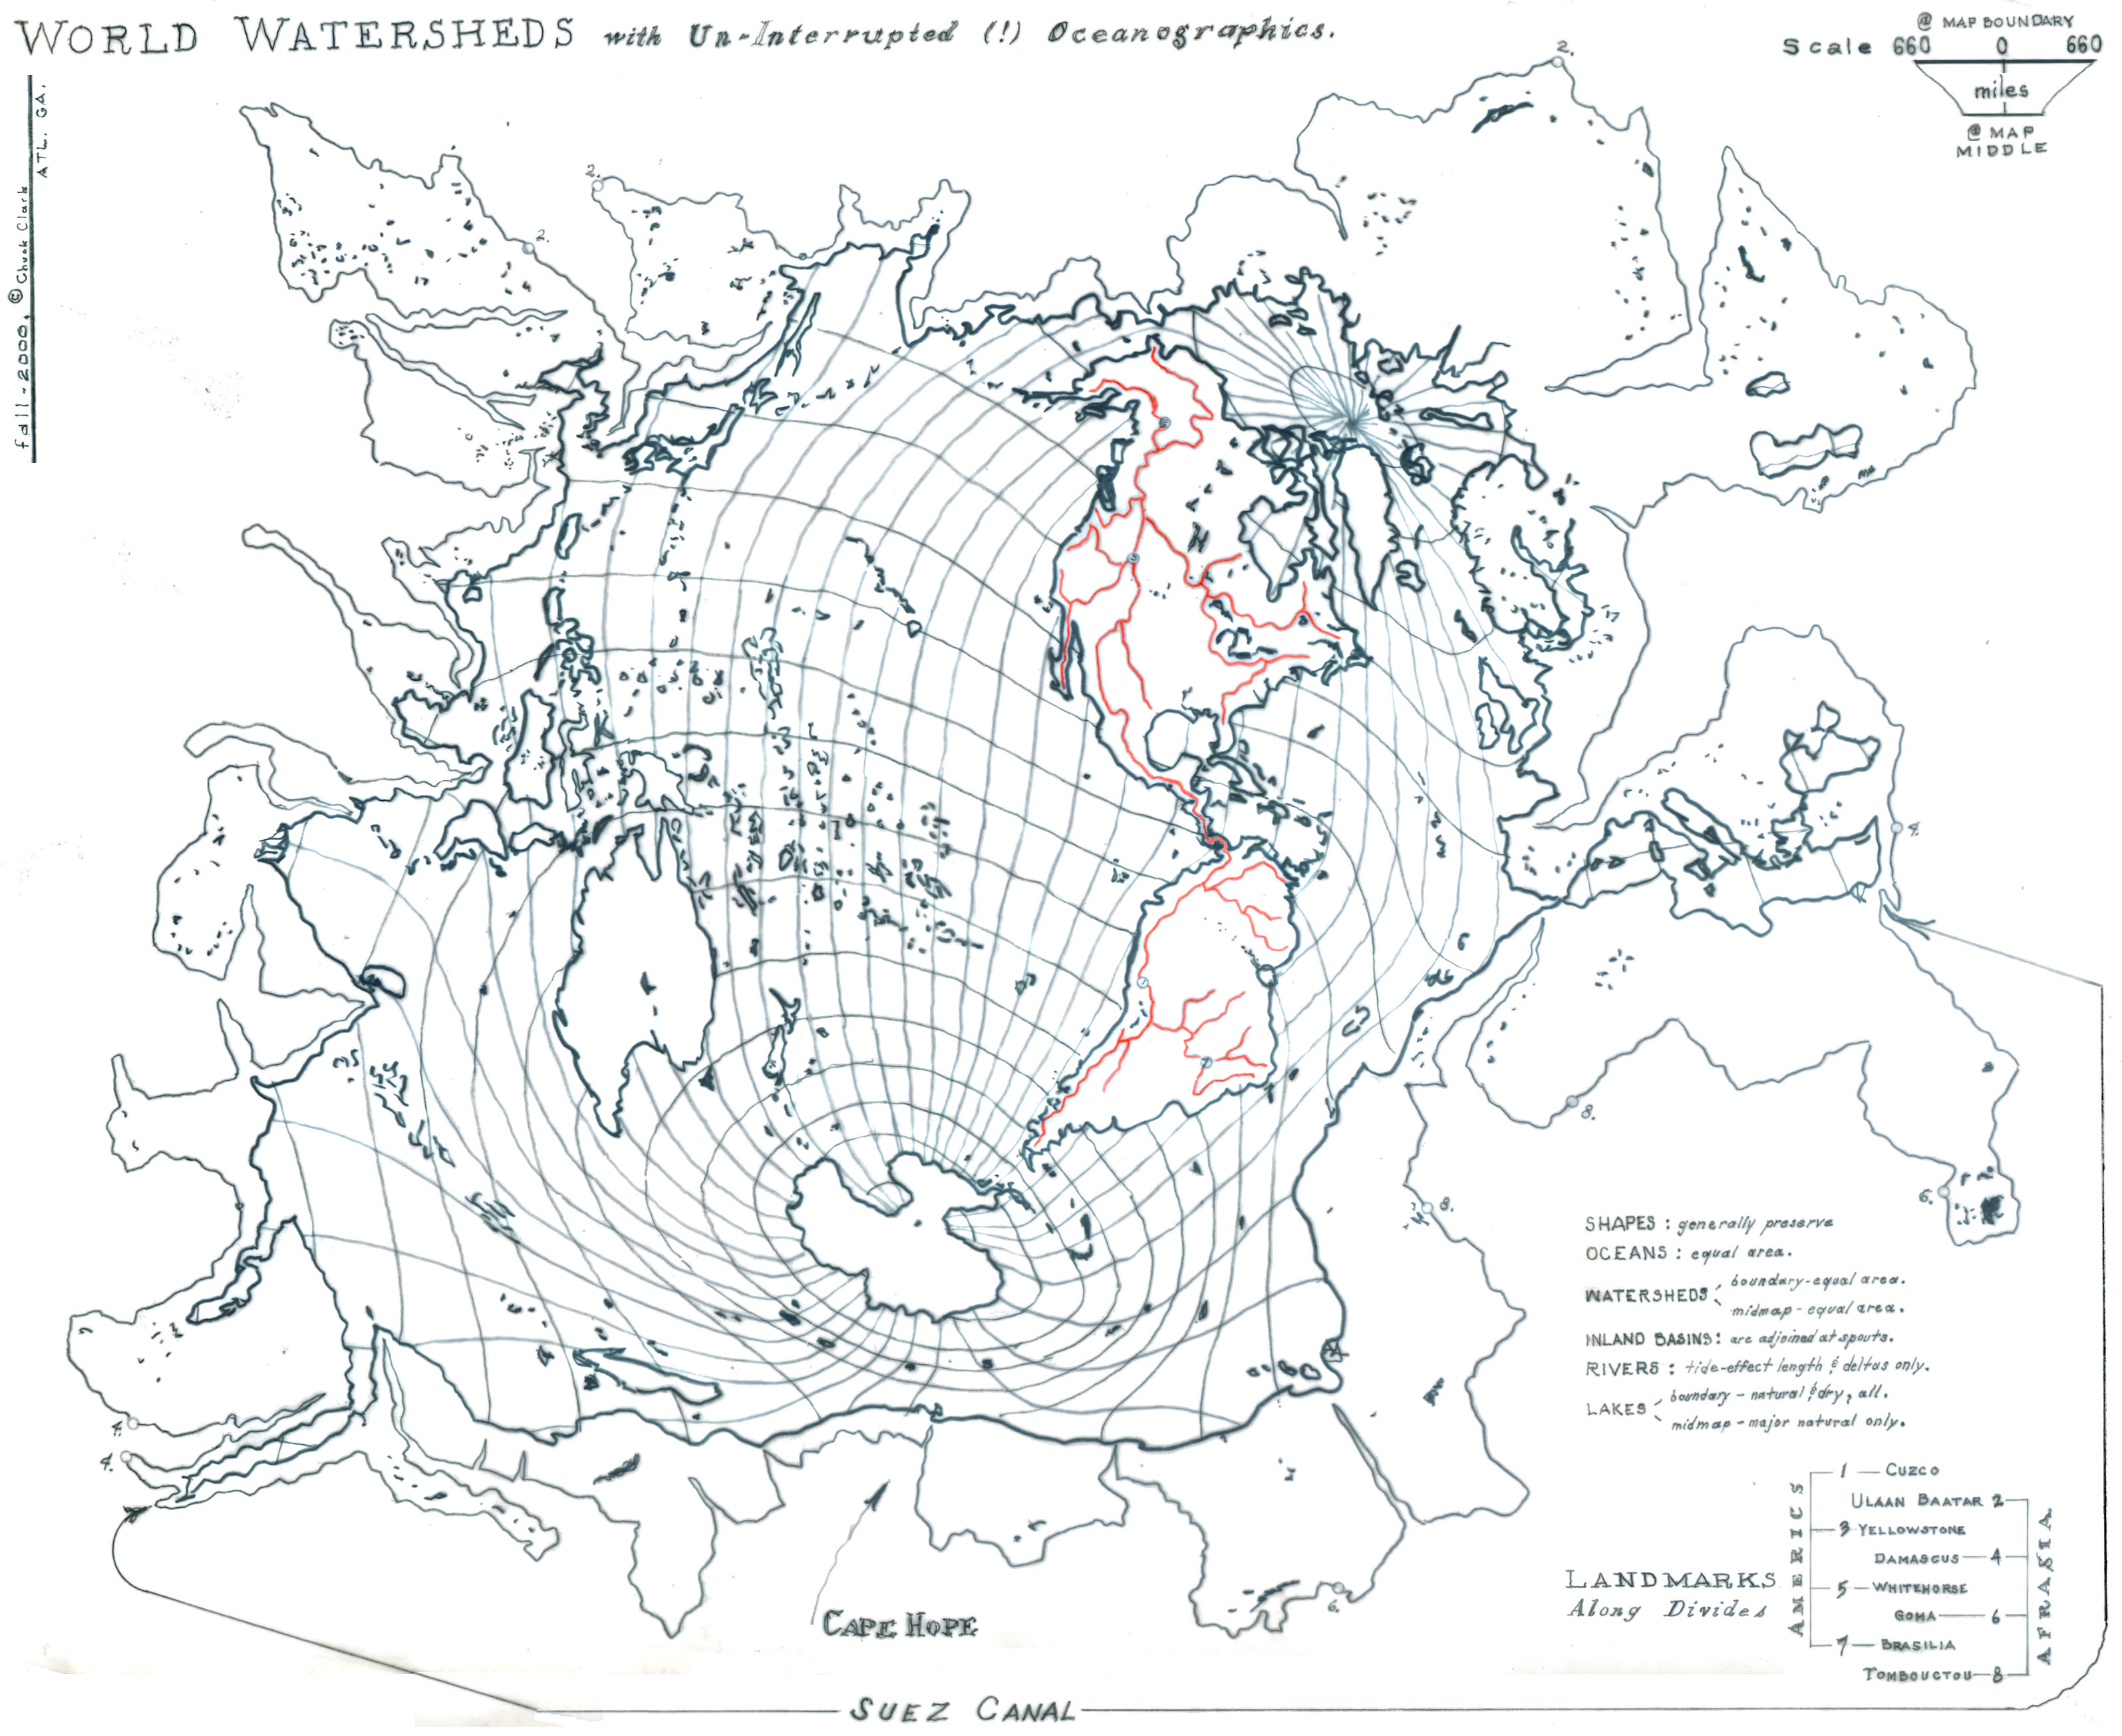
Note the scales at upper rights. They indicate the amount of shrinkage (about 2:1) in area from each map’s edge to each map’s middle. Each map carries a flaw of the cartographer. My mistake is not to have shrunk the middle more than I did. Thus each map has a squirrelly district — above in the south Atlantic; below in the north Atlantic — where I had to jam in more surface than I had room for, so to speak. I’ve since learned how to control that (I’ll fix these maps later, as well as describe the control methods).
To me the interesting use of these maps would be for display of weather patterns, because a much larger field of view than is customary for meteorological reporting, in fact the entire field of view, may be entertained here, respective of course, to the boundary of the map, which is the highest topography, there very topography expected to turn and stop advancing weather fronts. And in each map, the complete northern jet stream, that which stirs the weather, would be visible in its true circular shape. With these maps the search for large scale meteorological and climatological patterns, something which now is done only abstractly with statistics, so-called teleconnections, would get a visual boost.
And this without yet attempting to exploit the natural contours of weather patterns, barometric highs and lows, for tree-like systems of ridges and valleys which could not only fashion their own family of constant-scale natural boundary maps, but the edge, the outline of those maps could be made to change as the weather pattern changes. A cartographic animation of a weather sequence. a seasonal change, let’s say, as a mass of cold air heads toward the equator and a mass of hot air moves north to replace it in the spring. This year’s animation different from last years. May be you begin to see how useful this novel method of making world maps might be?

March 15, 2009 at 1:42 am
I justi discovered your musings and designs. Fantastic! Thank you for sharing all this. And yes, I see and totally agree that “this novel method of making world maps”, would be very effective! Wow!
June 8, 2014 at 5:32 am
Dear Chuck, we are currently editing a special edition of Harvard Design Magazine, titled “The Oceanic Turn”, which explores the urbanization of the oceans. We would love to learn more about your methodologies as designer and cartographer. towards potentially publishing one of your equal projection maps, such as the ‘World Watersheds and Un-Interrupted Oceanographics.’ The maps are simply stunning, they illicit many questions about your methods, and motivations. If you’re interested, it would be nice to touch base over the phone, my contact information is below. Thank you!
Pierre Bélanger
Associate Professor of Landscape Architecture
Co-Director, MDes Program
Harvard Graduate School of Design
belanger@harvard.edu
@lowlowtide
June 8, 2014 at 1:09 pm
What a nice idea. I’ll track down your phone number and give you a ring, first of next week.
Also, I’ve been neglecting to mention on this website that I’ve recently published, along with coauthor P.E. Clark (probably a distant relation), a scientific and technical monograph, Constant-Scale Natural Boundary Mapping to Reveal Global and Cosmic Processes (116 pages, 53 plates, Springer 2013), which may answer your questions about methods and motivations. Can’t say for sure as some of the writing seems to me (though not to my coauthor) to be a wee tiny bit of too dense to follow, grammatically.
http://www.springer.com/earth+sciences+and+geography/geographical+information+systems/book/978-1-4614-7761-7
Note that some material is available on the Springer website for free preview.
Let me know if the price is too dear; I may be able to send you a sample chapter or two.
Note too that it is inaccurate to describe these maps, and in particular the maps you cite, as “equal projection maps” (or what you may have meant to say: “equal area” projection maps). As a system they are distinct from the five-century tradition that descends from Mercator and Wright, and are the first crude examples of an infinitely large new class of maps I have named “constant-scale natural boundary.” To stay on-topic here (a few tangents of info below), when the CSNB maps are transformed from “trees” of large-scale global reach and are finely branched, the results are indeed equal area. But when the trees, even if finely branched (as in the maps you cite), extend over a limited portion of the globe (as in the maps you cite), the results are definitely NOT equal area. Note the scale doohickie in the upper-right corner of each map; the middle portions are roughly half the scale at which the edge is drawn.
Although I grant you that the peripheral watersheds (drawn at constant scale and with the “tree-dial” set at finely branched) are equal area, as well as true shape, relative to the others on the perimeter.
TANGENTS
ON “TREE”: I borrow the term “tree” from topology. As I use it, it is the one-dimensional network from which the CSNB map’s edge is transformed. Imagine drawing onto a globe the edge of any world map, no matter one of my widely figured maps or a conventional map. The result is a stick figure, a tree, in the case of a Mercator map, a single line of longitude, pole to pole. In the case of these CSNB maps, a line that, branching, follows continental and watershed divides to (or nearly to) the coasts. At risk of repeating myself, note that each of the above maps displays in the mid-map continents the edge of the other map.
ON MERCATOR & WRIGHT: Mercator employed the then-new mathematics of perspective to create his map; within fifty years, Edward Wright of England published the algebraic shortcuts necessary to make Mercator maps without laborious hand-plotting of points. Carl Boyer’s A History of Mathematics tells us that, “with later improvements,” Mercator’s techniques of perspective have remained the fundamental cartographic paradigm.
ON MY USE OF THE TERM “NATURAL BOUNDARY”: this is a nod to Athelstan F. Spilhaus Sr., who pioneered what he called “world maps with natural boundaries.” Spilhaus employed conventional projections; I don’t, and there’s all the difference.
ON INACCURACY IN THESE TWO MAPS: At risk again of repeating myself, these two maps were the end result of an experiment, 1996-1999, in what I called “zipping” (same term in the 2013 SpringerBrief. My kids were young in those years and we watched a lot of Mister Roger’s Neighborhood.) Zipping, as I imagined it, was a process of tree pruning, a shortening the map boundary set, in order to create a successor map with an internal area of greater extent than the preceding map. See this website main-page post titled CSNB Map #2 for the map that began the series. Note in the text above the reference to “squirrelly” areas. My pal, Dutch mathematician Jarke van Wijke of Myriahedral fame, says to call this “imperfect manual synthesis.”
February 7, 2017 at 1:28 am
Hi Chuck, I have just come across your maps undertaking some research for my PhD at RMIT in the school of architecture. I wonder if it is possible to get a high res copy of your Constant Scale Natural Boundary Map of Earth edged by segments of the Atlantic, Southern, and Indian ocean “spreading centers”. I would also like to learn a little more about the techniques. Would they be described in your newly published book? Happy to send you some images of what I am doing. I am looking specifically at speculative urban design propositions in the north west of Australia.
Cheers
Emma Jackson
Program Director, Master of Urban Design
RMIT University
February 7, 2017 at 1:54 am
Emma,
sure. I’ll email you privately to discuss. Although note that the book is no longer “newly published.” (It was 2013.)
January 29, 2023 at 5:51 am
Dear Chuck, I am the curator of the 18th International Architecture Exhibition at La Biennale di Venezia, which opens in May 2023. I am fascinated by your work, in particular, the World Watersheds drawings, made in Fall 2000. I am currently editing the Exhibition Catalogue, entitled The Laboratory of the Future, which looks specifically at Africa and her Diaspora. I would very much like to use World Watersheds with Un-Interrupted (!) Oceanographics in the catalogue and wonder how I might go about getting permission. The catalogue will go to print on March 15, so there is some time pressure, for which I apologise.
Thanking you in anticipation,
Prof Lesley Lokko OBE
Founder & Director
African Futures Institute
Curator, 18th International Architecture Exhibition of La Biennale di Venezia
January 29, 2023 at 4:01 pm
Lesley, Let’s discuss. I’ve sent you an email.